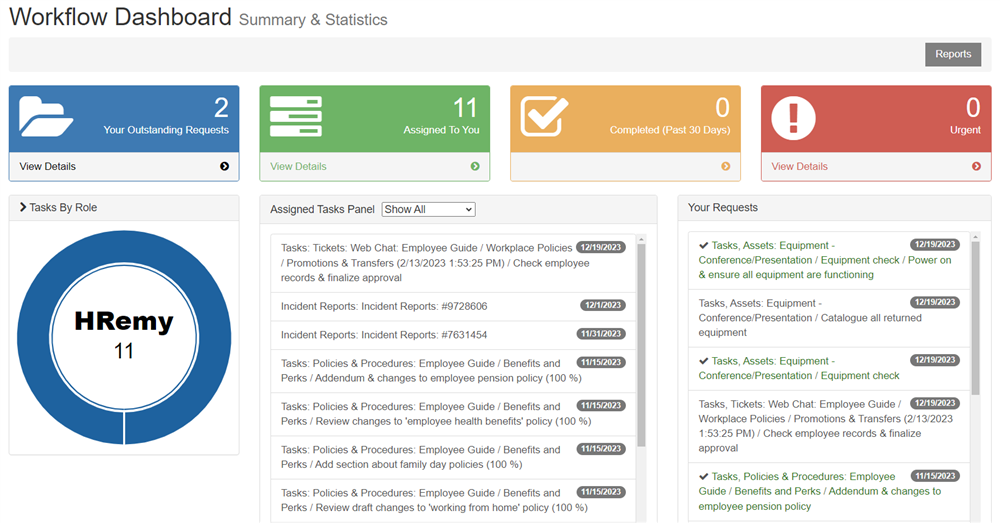
The Dashboard
Every Wiki Manager will have a tab link along the top called "Dashboard". This will show your workflow dashboard, with details about all of the assignments for you across the entire system. The purpose of this is to bring all of that information together into one page, so you don't have to go hunting for assignments and so nothing falls between the cracks.
Note: If you want to add a dashboard for end-users, consider this technique.

The dashboard has several sections. Along the top there is a gray strip that has a "Reports" button at the end. If you click this, it will show a list of global reports that can be run. These reports will provide you insight into many of your policies.
Under that are colored boxes that provide the count of items in each category: the first shows you the count of your outstanding requests. The second, the count of items that are assigned to you. The next item is the number of completed tasks, and the last is the count of tasks or tickets that are marked as urgent.
In the next section under that, we see a pie chart that shows how the assignments are distributed among both your user and roles. If you have multiple roles (eg. Risk Analyst, Auditor), then you'll see pie slices for each of those roles, with the corresponding number of assignments related to each.
Next to that is your assignments panel. This will show the list of assignments. You can expand this by clicking "View All" below it. You can also filter by the type of assignment in the dropdown box above that, that says "Show All". You can click any of these assignments to take you to the record that is assigned to you for further action.
On the far right side is the list of your requests. These are tasks or drafts that you created but are assigned to other users. You can use this list to track those requests so you can see when they are completed.
Underneath this is a calendar that will show any deferred tasks. These are tasks that were created but scheduled for a later date. It will also show policy review and expiration tasks.
